How To Undo Changes In MS Excel 2010
MS Excel offers two smart ways to reverse every action in the worksheet using the Undo command.
• Go to the Quick access too-bar and click on Undo.
• Simply Press Control + Z
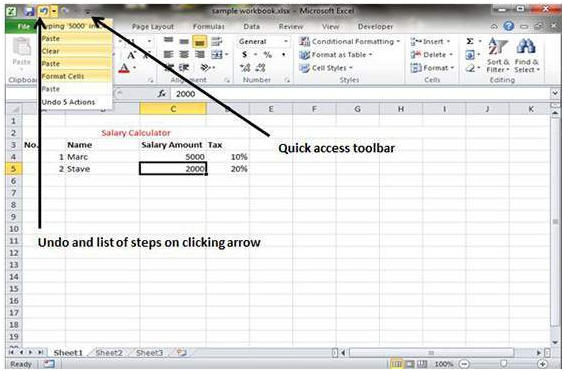
The Undo command allows users to reverse the effects of past 100 actions.
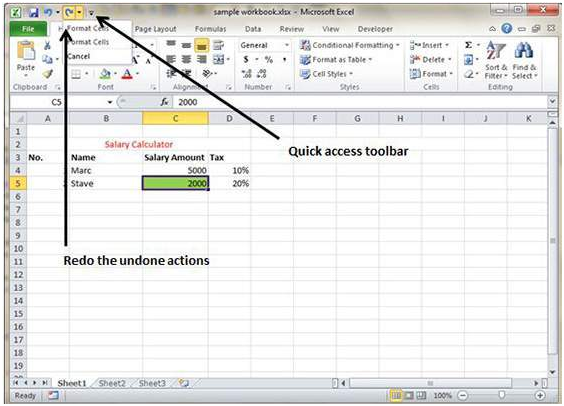
Redo Changes
Users can easily reverse back the action done with the undo command in Excel worksheet by using the Redo command. It also can be done in two smart ways.
• Go to the Quick Access tool bar and click on the Redo icon
• Simply Press Control +Y

You may also like...


Sorry - Comments are closed