How To Create Charts In MS Excel 2010
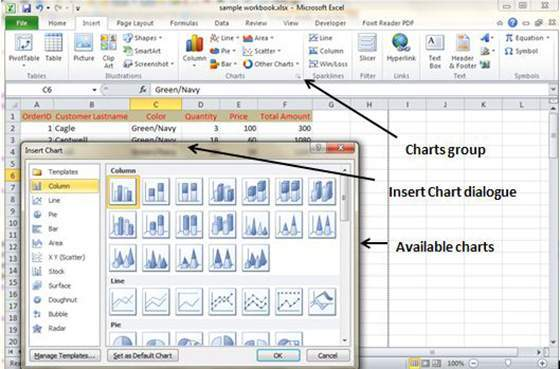
Charts helps in bringing a visual representation of the numeric values. MS Excel offers various chart types that can be inserted in the worksheet. The different kinds of charts include Column, Bar, Pie, Line, Area, X Y Scatter, Stock, Radar, Surface, Bubble and Doughnut styles.
In order to create, follow these simple steps.
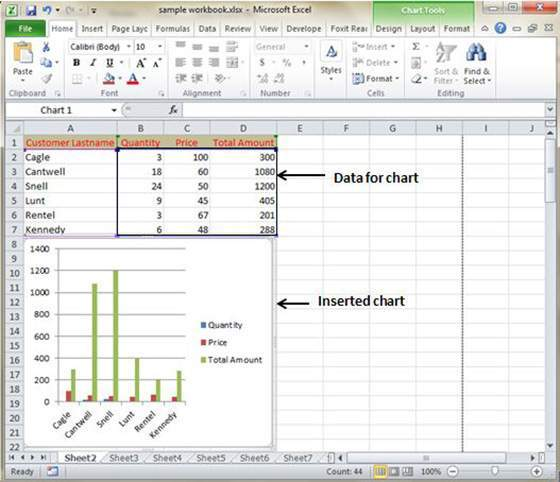
- First, select the data with which you wish to create a chart.
- Then, go to the Insert Tab, followed by Select the chart or click on the Chart group in order to various chart types.
- Once you had selected the preferred chart, click on OK to generate the chart.
Editing Chart
Once you had inserted the chart in the worksheet, it can be edited anytime.
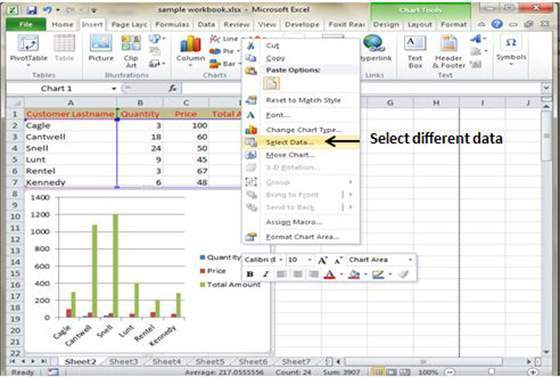
Select a different set of data for chart input by Right clicking on the chart, followed by Select Data. Selecting new data will result in generating the chart according to the new data.
- You can even make changes in the X and Y-axis of the chart by giving different input to the X and Y-axis of the chart.
- Previous How To Create Pivot Tables In MS Excel 2010
- Next How To Create Pivot Charts In MS Excel 2010
You may also like...
Sorry - Comments are closed


