How To Create Pivot Tables In MS Excel 2010
Pivot table makes it easier to create a dynamic summary report from the database. Pivot Tables can be created in MS Excel by going to the Insert tab, followed by PivotTable dropdown and click on PivotTable.
Pivot Table Example
Assume you have a huge data of voters and you wish to see a summarized data of voter information as per party. Then, go to the Insert tab and click on the PivotTable.
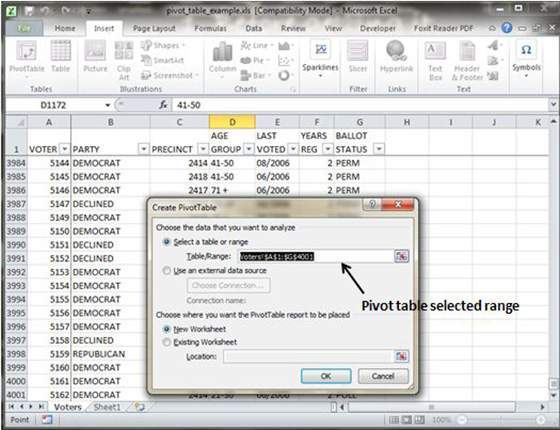
Now a Pivot Table pane will be created in the worksheet like the one shown in the image. Here you can set the fields for generating a pivot table. These fields will include the Column labels, Report Filter, Row Labels and Value areas.

Once you had provided the required input fields, Excel will automatically generate the pivot table with the needed data in the worksheet.
Tags How To Create Pivot Tables In MS Excel 2010MS Excel Tutorial

You may also like...


Sorry - Comments are closed